AgFlo technology
AgFlo combines rugged connected sensors with an intelligent platform that turns feed inventory data into forecasts and insights for better decisions.
The connected sensor
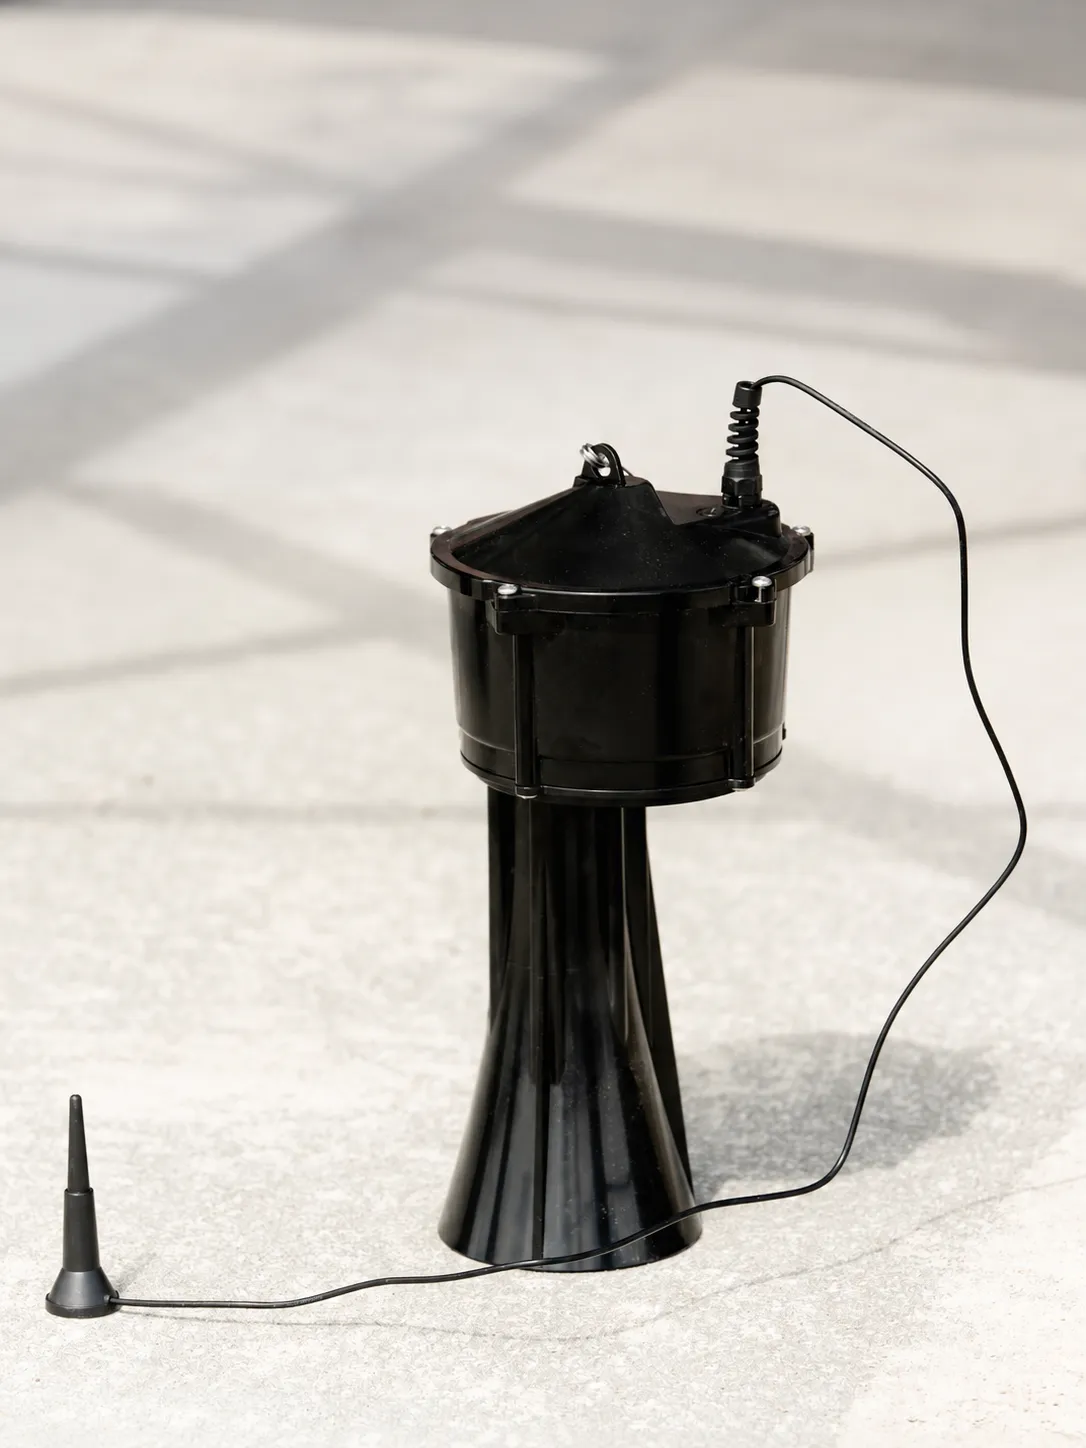
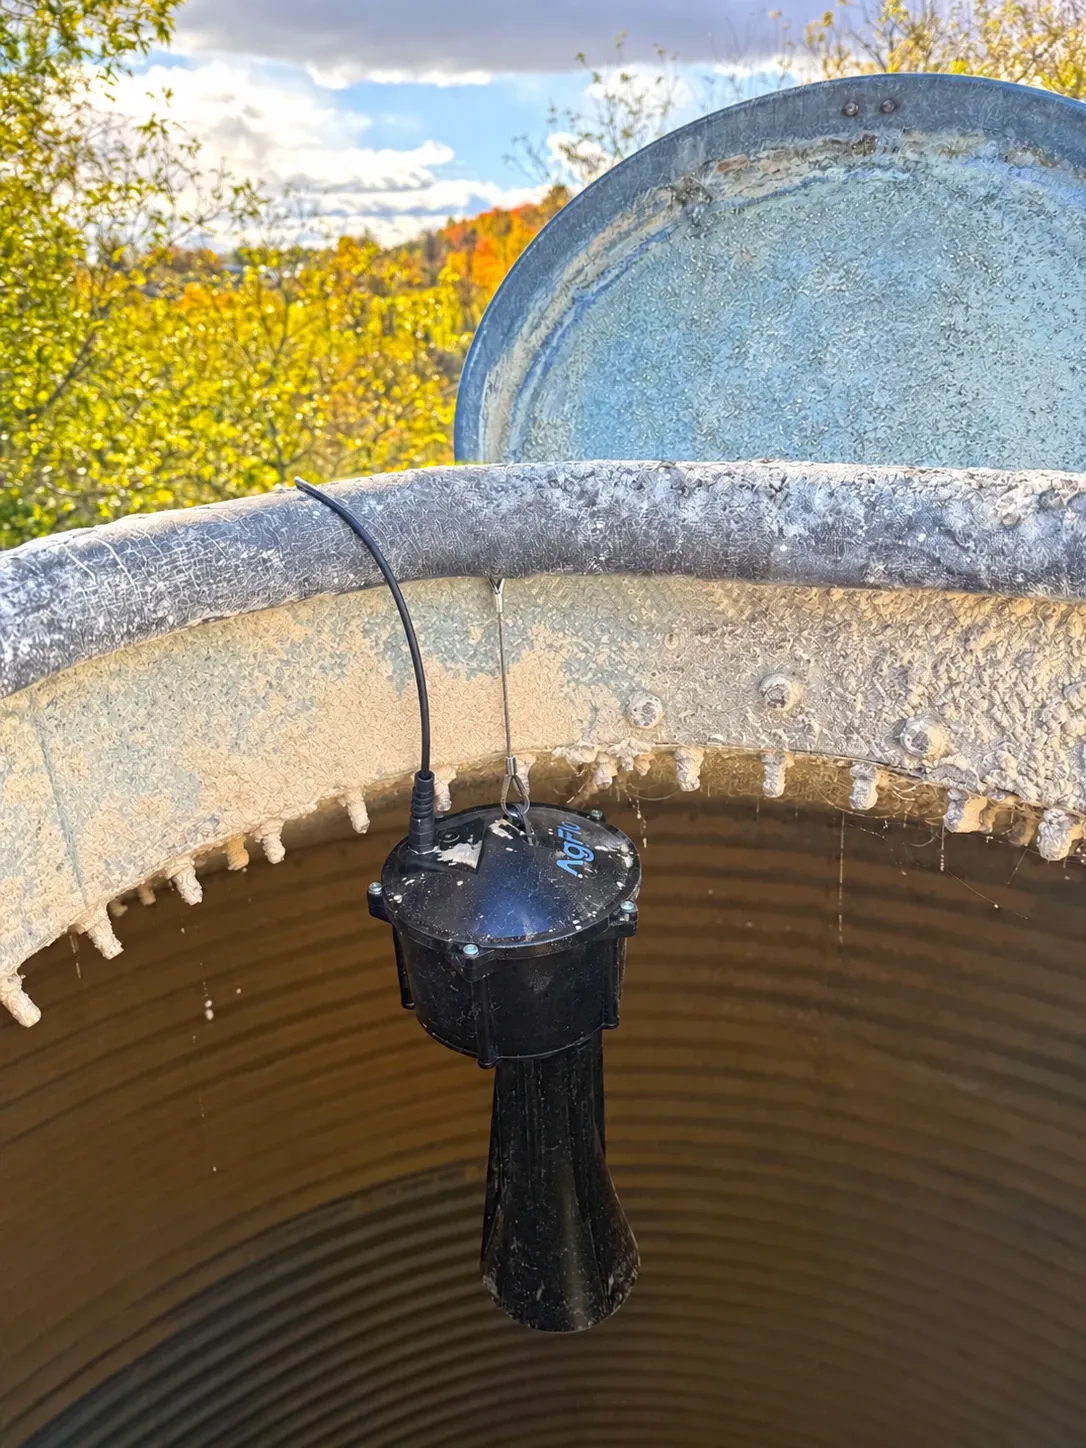
An ultrasonic sensor installed inside each feed bin, suspended from the edge of the opening and connected to the AgFlo platform to monitor your inventory remotely.
Get started in three steps
Install the sensor
Install the sensor inside the bin following the steps in the app.
Set up your bin
Enter the bin details in the app to prepare it for monitoring.
View your data
Open the AgFlo platform to start monitoring your bins remotely.
Precision you can trust
A single-point reading can be affected by a dip or peak in the feed surface. AgFlo uses readings spread across the width of the bin to calculate the inventory level.
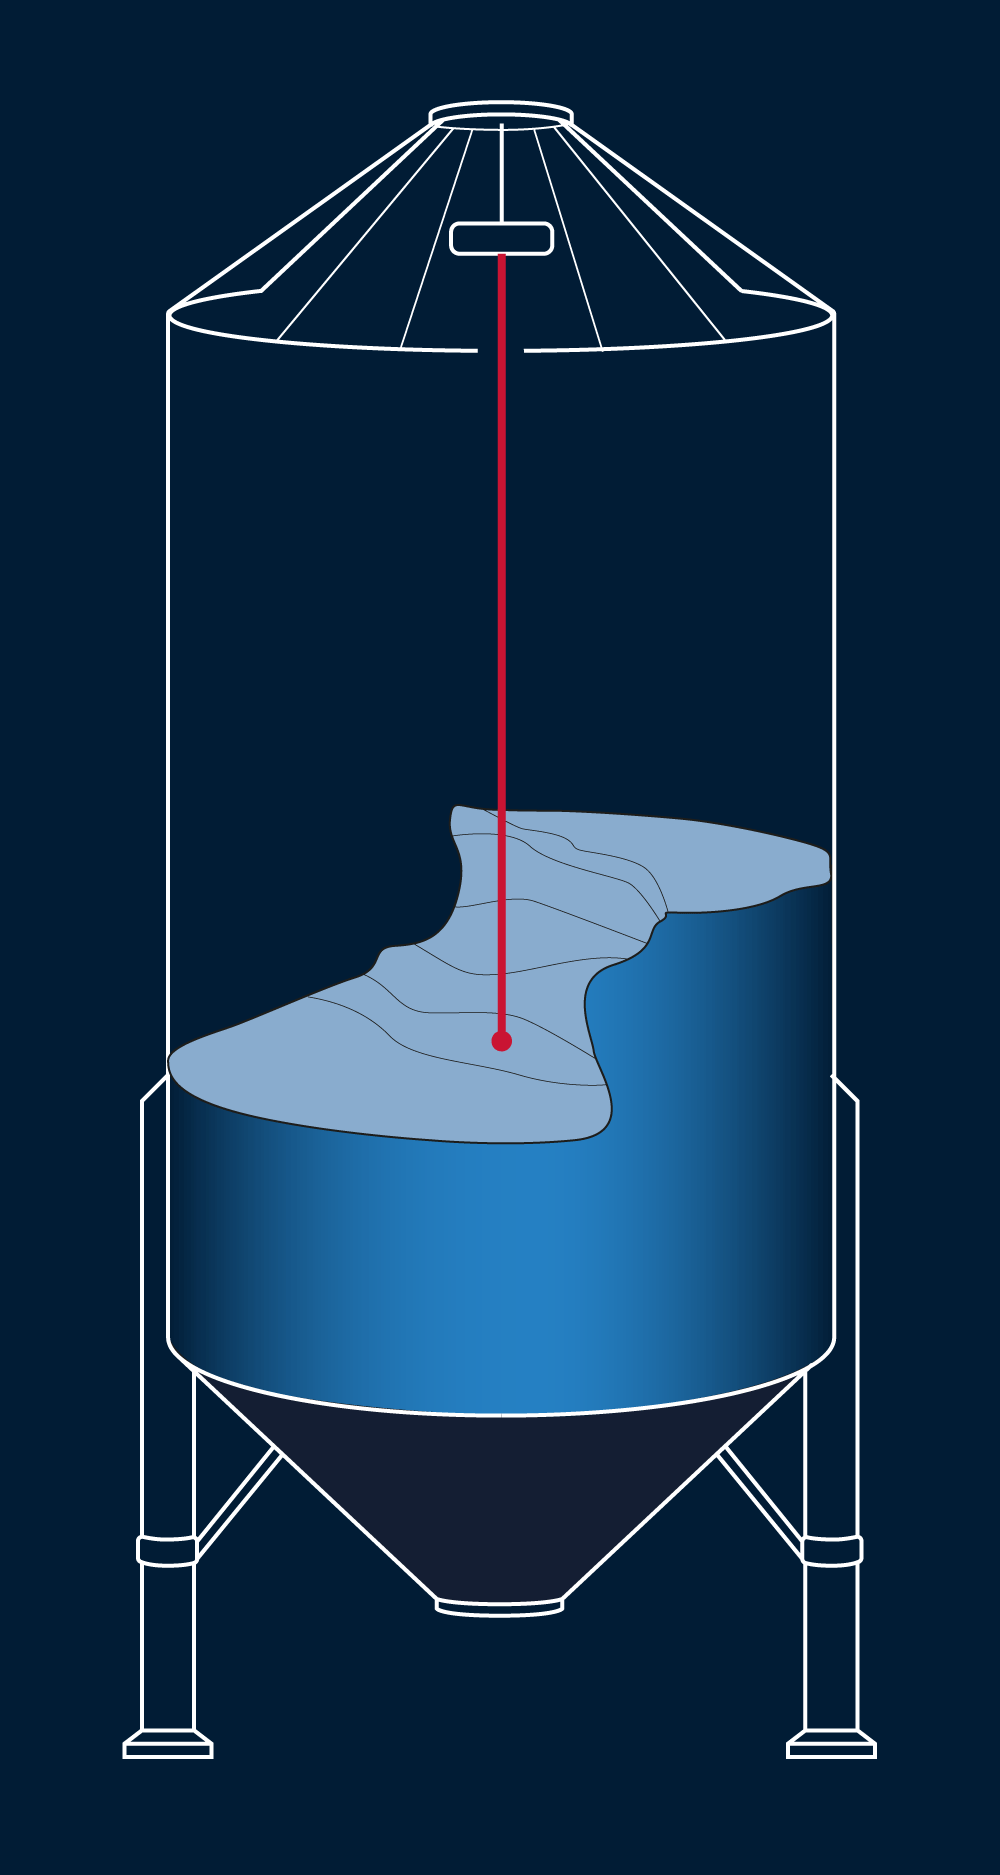
Single-point measurement
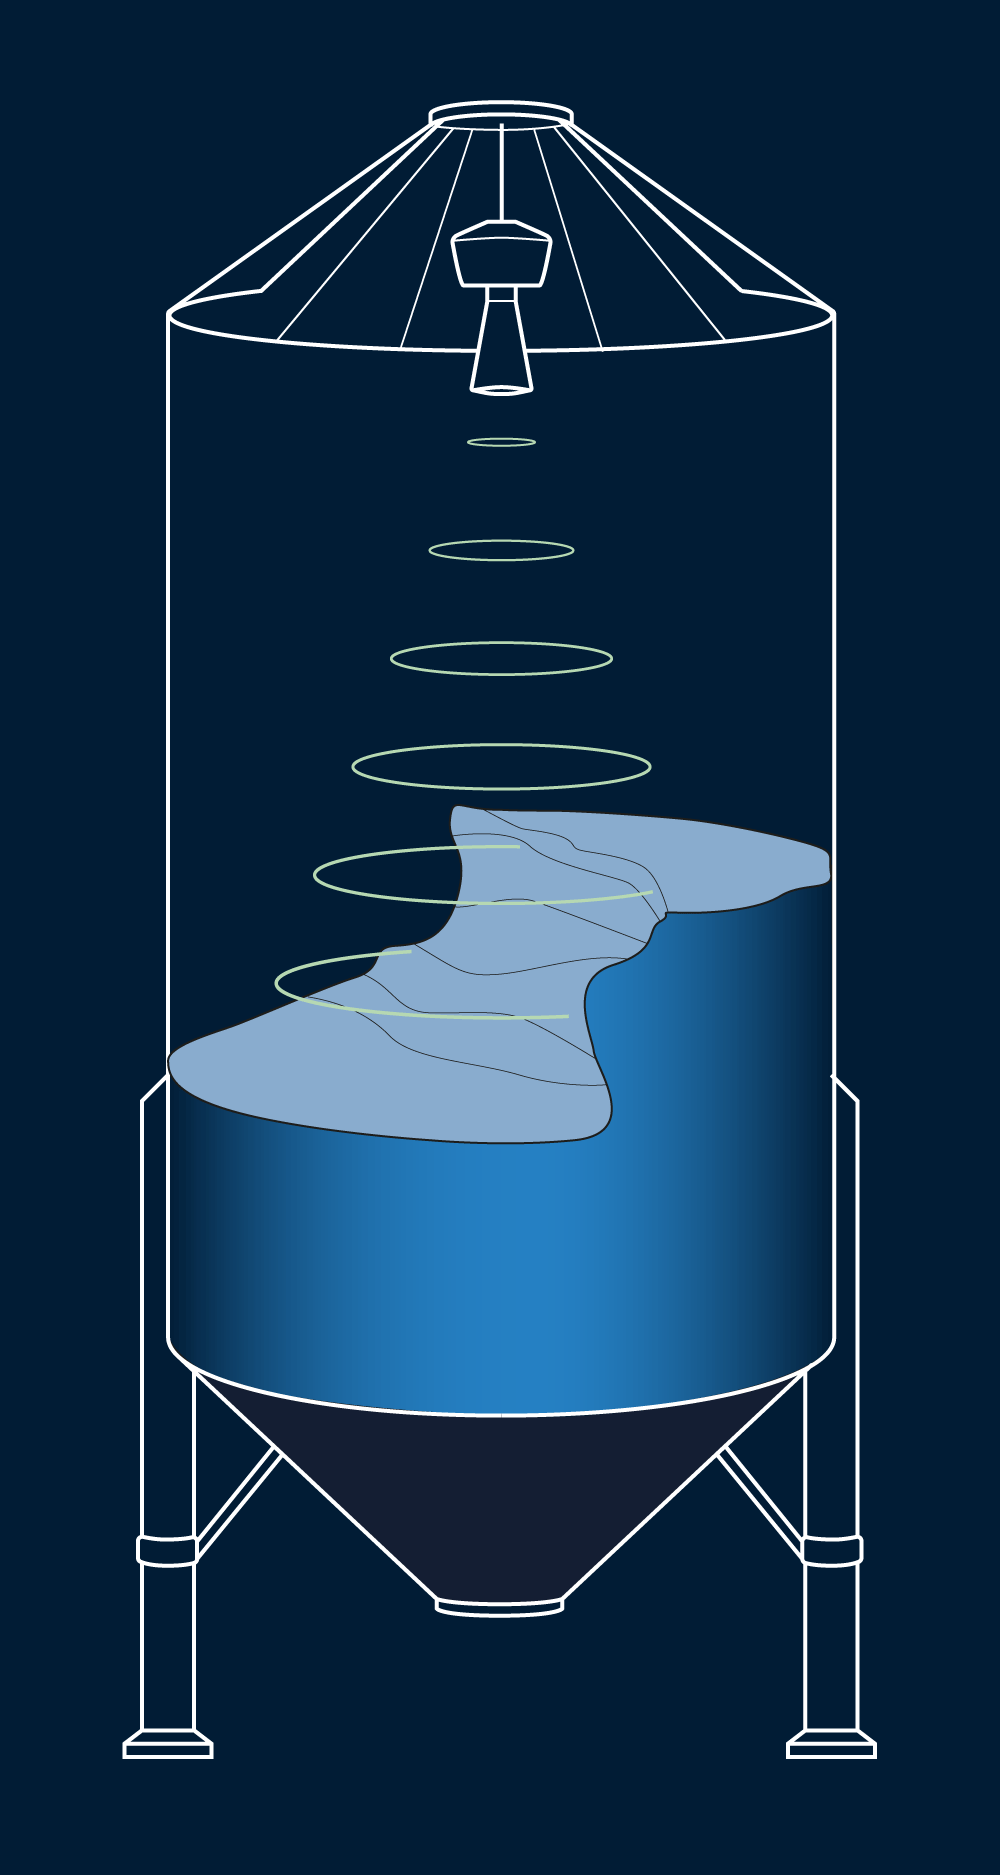
AgFlo distributed measurements
A single-point reading can be affected by a dip or peak.
Several measurements spread out → a reading that matches the real volume.
Easy to install
Installs in less than 15 minutes per bin. No wiring, external power or bin modifications required.
Long battery life
Runs on standard, replaceable lithium AA batteries with more than 2 years of battery life.
LTE connectivity included
Built-in LTE-M connectivity, ready to use. No separate cellular plan or on-site gateway required.
Designed, developed and assembled in Canada
A solution that continuously improves, from its algorithms to sensors already installed in the field
How AgFlo works
Capture
The sensor collects ultrasonic readings inside the bin.
Transmit
LTE-M connectivity sends the readings to the AgFlo cloud platform without an on-site gateway.
Analyze and predict
The platform analyzes the readings to calculate feed inventory levels and predict when bins will be empty.
View
Access the processed data in the AgFlo platform or your management tools.
From data to decisions
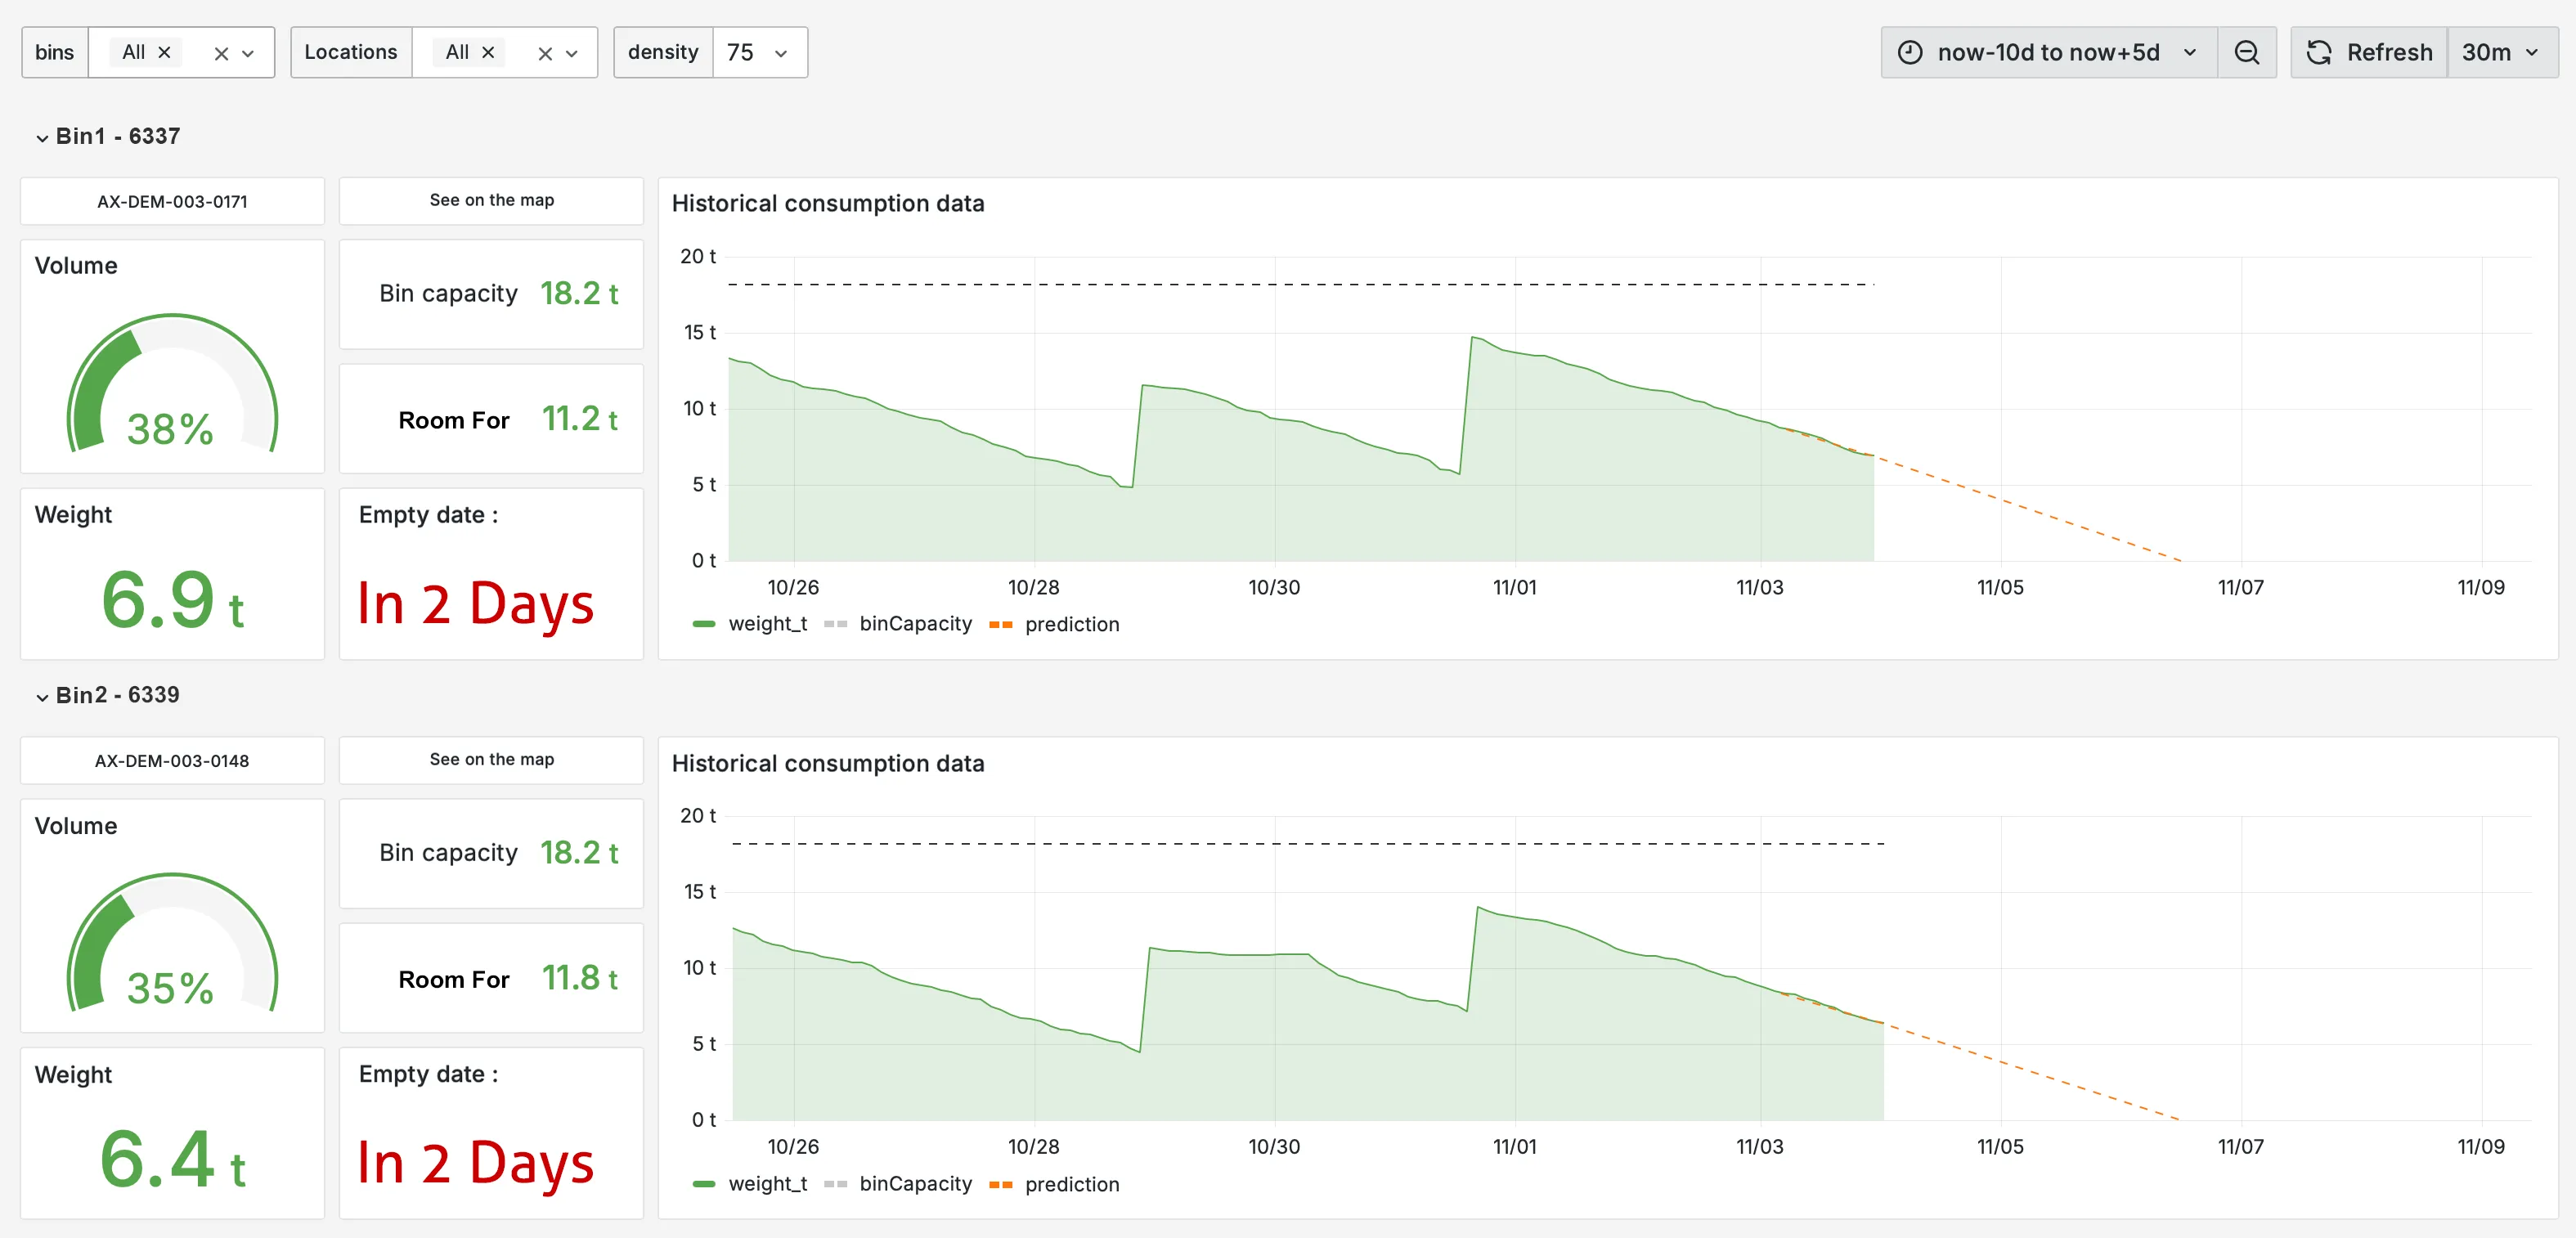
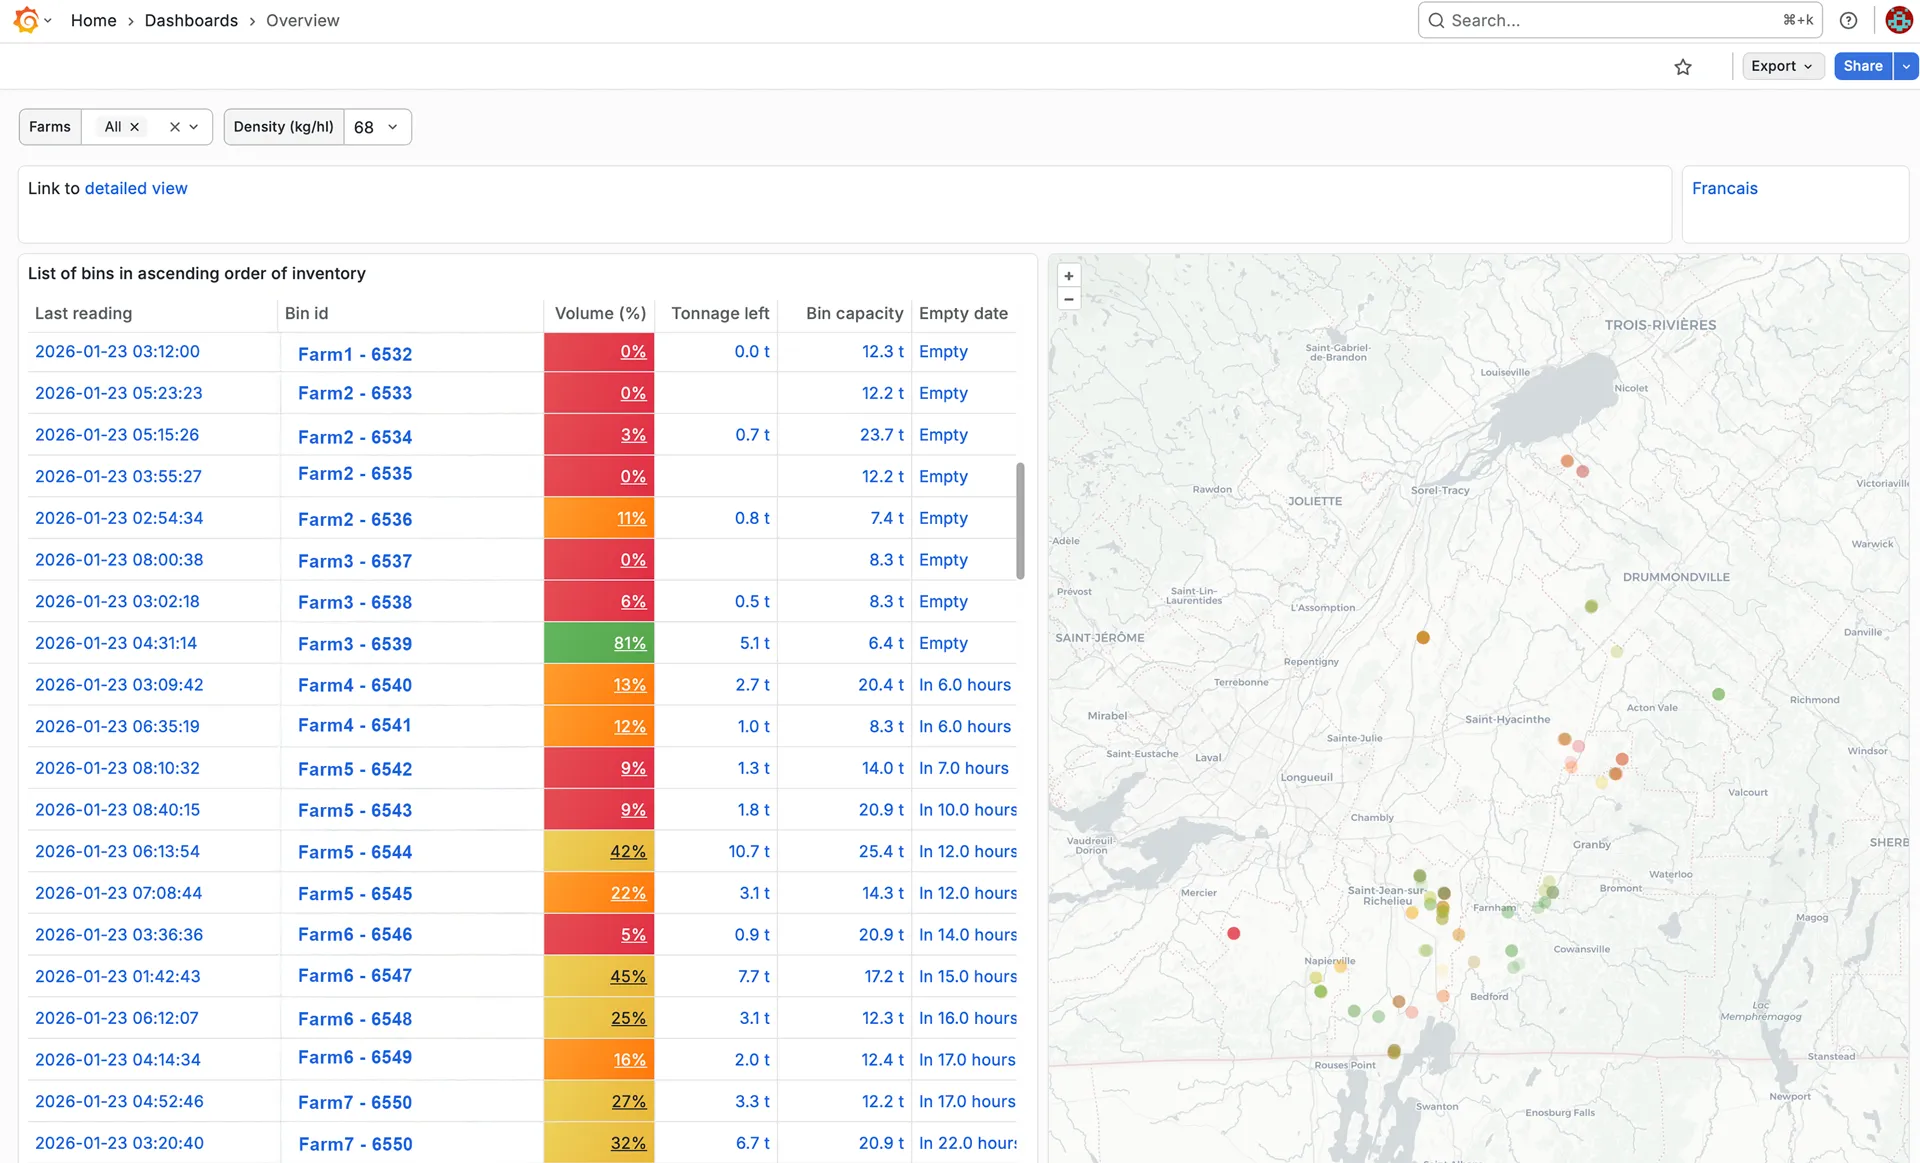
A clear view of your feed inventory, with forecasts to help you plan ahead.
View feed levels and predicted empty dates in the AgFlo platform or your management tools. Our algorithms analyze the readings to help you plan ahead and improve your operations.
Connect AgFlo to your existing software: feed levels and forecasts can feed your ERP to support replenishment planning. Our team helps define the integration for your systems and workflows.